Dosya:Kscaleprojections.png
Özet
| Açıklama |
Русский: Шкала Кардашева
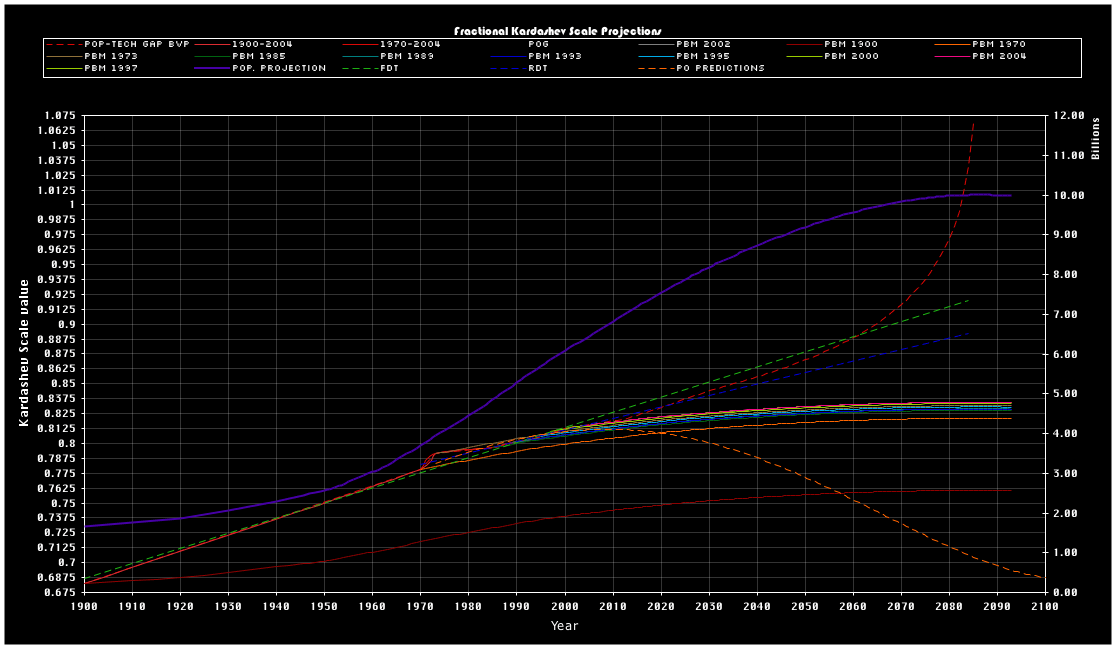
English: An image of Kardashev scale projections ranging from 1900 to 2100. The projections are off by 0.1 on the kardashev scale. This is graphed against the supportable population and given growth against the supposed technology growth associated the kardashev scale. Projections are made by different ratios of energy production to technology growth for a given level of energy (and technology) against predicted population growth, and new technology production and new energy production needed to support a given population, and the growth of such population. In some projections, if energy production is unable to keep up with population growth, technology levels fall. In some projections, as population growth slows, supposedly increased technology can be produced via the lower amount of energy needed to sustain population growth.
Outside comment : It appears much of the data were taken from International Energy Agency, World Energy Outlook 2005, pg. 82, according to User:Sparkygravity. The following is an incomplete legend of lines plotted, with completeness to follow once all original acronyms can be deciphered:
Note that there are no units given for any such plots, though the population projection probably aligns on the right and another user has suggested that the energy "PBM" scales are converted from IEA data on the left. This makes the combination of logarithmic and linear vertical scales, as well as population and energy scales, on the same axis questionable at best, but more likely useless and confusing, and therefore should likely be cleaned up if this image is to retain any usability. Many articles and reproductions online (notably Technological Singularity have vastly misinterpreted this graph in thinking that all lines are Kardashev-scale projections, which has been shown to not be the case. Only the dense cluster of lines are projections relevant to the left-hand Kardashev scale. It is therefore recommended that captions be changed and this image not be used further in any encyclopedia articles for ongoing ambiguity, original research, and confusion in plotting. |
| Tarih | 7 Temmuz 2005 (original upload date) |
| Kaynak | en.wikipedia üzerinden Commons'a transfer edildi. |
| Yazar | Ctrl build at İngilizce Vikipedi |
Lisanslama

|
Bu belgenin GNU Özgür Belgeleme Lisansı, Sürüm 1.2 veya Özgür Yazılım Vakfı tarafından yayımlanan sonraki herhangi bir sürüm şartları altında bu belgenin kopyalanması, dağıtılması ve/veya değiştirilmesi için izin verilmiştir;
Değişmeyen Bölümler, Ön Kapak Metinleri ve Arka Kapak Metinleri yoktur. Lisansın bir kopyası GNU Özgür Belgeleme Lisansı sayfasında yer almaktadır. |
| Bu dosya, Creative Commons Atıf-Benzer Paylaşım 3.0 Taşınmamış lisansı ile lisanslanmıştır | ||
Atıf:
| ||
| ||
| Bu lisanslama etiketi, dosyaya GFDL lisanslama güncelleştirmenin bir parçası olarak eklenmiştir. |
- Şu seçeneklerde özgürsünüz:
- paylaşım – eser paylaşımı, dağıtımı ve iletimi
- içeriği değiştirip uyarlama – eser adaptasyonu
- Aşağıdaki koşullar geçerli olacaktır:
- atıf – Esere yazar veya lisans sahibi tarafından belirtilen (ancak sizi ya da eseri kullanımınızı desteklediklerini ileri sürmeyecek bir) şekilde atıfta bulunmalısınız.
- benzer paylaşım – Maddeyi yeniden düzenler, dönüştürür veya inşa ederseniz, katkılarınızı özgünüyle aynı veya uyumlu lisans altında dağıtmanız gerekir.
Orijinal yükleme günlüğü
- 2008-02-01 07:29 Xiong Chiamiov 1115×647× (23395 bytes) optimized using optipng
- 2005-07-07 18:59 Ctrl build 1115×647× (28801 bytes) An image of Kardashev scale projections ranging from 1900 to 2100. The projections are off by 0.1 on the kardashev scale. This is graphed against the supportable population and given growth against the supposed technology growth associated the the kardash
Dosya geçmişi
Dosyanın herhangi bir zamandaki hâli için ilgili tarih/saat kısmına tıklayın.
| Tarih/Saat | Küçük resim | Boyutlar | Kullanıcı | Yorum | |
|---|---|---|---|---|---|
| güncel | 22.13, 27 Haziran 2012 | | 1.115 × 647 (23 KB) | wikimediacommons>OgreBot | (BOT): Reverting to most recent version before archival |
Dosya kullanımı
Aşağıdaki sayfa bu dosyayı kullanmaktadır: